

Complexity Theory
Our definition of complex systems included spontaneous organization, unpredictability, the need for exponentially greater energy inputs and the potential for catastrophic collapse. Another way to understand complexity is to contrast it with that which is merely complicated. A Swiss watch may be complicated, but it is not complex. The number and size of various gears, springs, jewels, stems and casings make it complicated. Yet the parts do not communicate with one another. They touch but do not interact. One gear does not enlarge itself because the other gears think it is a good idea. The springs do not spontaneously self-organize into a liquid metallic soup. The watch is complicated; however, complexity is much more than complication.
Complex systems begin with individual components called autonomous agents, which make decisions and produce results in the system. These agents can be marine species in the oceanic food chain or individual investors in currency markets; the dynamics are the same. To be complex, a system first requires diversity in the types of agents. If the agents are alike, nothing very interesting will happen. If they are diverse, they will respond differently to various inputs, producing more varied results.
The second element is connectedness. The idea is that the agents are connected to one another through some channel. This can consist of electrical lines in the case of a power grid or Twitter feeds in the case of a social network, but somehow the agents must have a way to contact one another.
The third element is interdependence, which means that the agents influence one another. If someone is not sure how cold it is outside and she looks out the window to see everyone wearing down coats, she might choose to wear one too. The decision is not automatic—she might choose to wear only a sweater—but in this case a decision to wear a warm coat is partly dependent on others’ decisions.
The last element is adaptation. In complex systems, adaptation means more than change; rather it refers specifically to learning. Investors who repeatedly lose money on Wall Street themes such as “buy and hold” may learn over time that they need to consider alternative strategies. This learning can be collective in the sense that lessons are shared quickly with others without each agent having to experience them directly. Agents that are diverse, connected, interdependent and adaptive are the foundation of a complex system.
To understand how a complex system operates, it is necessary to think about the strength of each of these four elements. Imagine each one has a dial that can be turned from settings of zero to ten. At a setting of one, the system is uninteresting. It may have the elements of complexity, but nothing much is going on. Diversity is low, connectedness and interdependence are weak and there is almost no learning or adaptation taking place. At a setting of ten, the system is chaotic. Agents receive too much information from too many sources and are stymied in their decision making by conflicting and overwhelming signals.
Where complexity is most intriguing is in what Scott Page of the University of Michigan calls the “interesting in-between.” This means the dials are set somewhere between three and seven, with each dial different from the others. This allows a good flow of information, interaction and learning among diverse agents, but not so much that the system becomes chaotic. This is the heart of complexity—a system that continuously produces surprising results without breaking down.
Two further characteristics of complex systems are of the utmost importance in our consideration of their application to currency markets and the dollar. These are emergent properties and phase transitions.
Saying a system has an emergent property is like saying the whole is more than the sum of its parts. Tasting a delicious, warm apple pie is more interesting than looking at the dough, sugar, apples and butter that went into it. When systems are highly complex, emergent properties are far more powerful and unexpected. Climate is one of the most complex systems ever studied. It is extremely difficult to model, and reliable weather forecasts can be made only about four days in advance. Hurricanes are emergent properties of climate. Their ingredients, such as low air pressure, warm water, convection and the like, are all easily observed, but the exact timing and location at which hurricanes will emerge is impossible to predict. We know them when we see them.
The best example of an emergent property is probably human consciousness. The human body is composed of oxygen, carbon and hydrogen, with traces of copper and zinc thrown in for good measure. If one were to combine these ingredients in a vat, stir carefully and even jolt the mixture with electricity, nothing would happen. The same ingredients combined through DNA coding, however, produces a human being. There’s nothing in a carbon molecule that suggests thought and nothing in an oxygen molecule that suggests speech or writing. Yet the power of complexity produces exactly those capabilities using exactly those ingredients. Thought emerges from the human mind in the same complex, dynamic way that hurricanes emerge from the climate.
Phase transitions are a way to describe what happens when a complex system changes its state. When a volcano erupts, its state goes from dormant to active. When the stock market drops 20 percent in one day, its state goes from well behaved to disorderly. If the price of gold were to double in one week, the state of the dollar would go from stable to free fall. These are all examples of phase transitions in complex systems.
Not every complex system is poised for a phase transition—the system itself must be in a “critical state.” This means that the agents in the system are assembled in such a way that the actions of one trigger the actions of another until the whole system changes radically. A good example of a phase transition in a critical state system is an avalanche. A normal snowfield on a flat surface is fairly stable, yet the same amount of snow on a steep incline may be in a critical state. New snow may fall for a while, but eventually one snowflake will disturb a few others. Those others will disturb more adjacent flakes until a small slide begins that takes more snow with it, getting larger along the way until the entire mountainside comes loose. One could blame the snowflake, but it is more correct to blame the unstable state of the mountainside of snow. The snowfield was in a critical state—it was likely to collapse sooner or later, and if one snowflake did not start the avalanche, the next one could have.
The same process occurs in a stock market crash. Buy and sell orders hit the market all the time just like snowflakes on the mountain. Sometimes the buyers and sellers are arranged in highly unstable ways so that one sell order triggers a few others, which are then reported by the exchange, triggering even more sell orders by nervous investors. Soon the cascade gets out of control, and more sell orders placed in advance and triggered by “stop-loss” rules are automatically executed. The process feeds on itself. Sometimes the process dies out; after all there are many small disturbances in the snow that do little harm. Sometimes the process grows exponentially until something outside the system intervenes. This intervention can take the form of trading halts, efforts by buying syndicates to reverse the flow or even closing the exchange. Once the cascade stops, the complex system can return to a stable, noncritical state—until the next time.
The recent multiple catastrophes near Sendai, Japan, perfectly illustrate how phase transitions occur in nature and society and how collapse can spread from one system to another when all are in the critical state. Tectonic plates, oceans, uranium and stock markets are all examples of separate complex systems. However, they can interact in a kind of metasystemic collapse. On March 11, 2011, shifting tectonic plates under the Pacific Ocean off the eastern coast of Japan caused an extremely violent 9.0 earthquake. The thrusting of the ocean floor then transferred energy from one system, the earth’s crust, to another system, the ocean, causing a ten-meter-high tsunami. The tsunami smashed into several nuclear reactors, again transferring energy and causing another catastrophe, this time a partial meltdown in uranium and plutonium fuel rods used in the reactors. Finally, the fear induced by the meltdown in the reactors contributed to a meltdown in the Tokyo stock market, which crashed over 20 percent in two days. The earthquake and tsunami were natural systems. The reactor was a hybrid of natural uranium and man-made design, while the stock exchange is totally man-made. Yet they all operated under the same critical state dynamics embedded in complex systems.
Importantly, phase transitions can produce catastrophic effects from small causes—a single snowflake can cause a village to be destroyed by an avalanche. This is one secret behind so-called black swans. Nassim Nicholas Taleb popularized the term “black swan” in his book of the same name. In that book, Taleb rightly demolished the normal distribution—the bell curve— as a way of understanding risk. The problem is that he demolished one paradigm but did not produce another to replace it. Taleb expressed some disdain for mathematical modeling in general, preferring to take on the mantle of a philosopher. He dubbed all improbably catastrophic events “black swans,” as if to say, “Stuff happens,” and he left it at that. The term is widely used by analysts and policy makers who understand the “Stuff happens” part but don’t understand the critical state dynamics and complexity behind it. Yet it is possible to do better than throw up one’s hands.
A forest fire caused by lightning is a highly instructive example. Whether the fire destroys a single tree or a million acres, it is caused by a single bolt of lightning. Simple intuition might hold that large bolts cause large fires and small bolts cause small fires, but that is not true. The same bolt of lightning can cause no fire or a catastrophic fire depending on the critical state. This is one reason why black swans take us by surprise. They are called extreme events, but it would be more accurate to call them extreme results from everyday events. Extreme results will happen with some frequency; it is the everyday events that trigger them that we don’t see coming precisely because they are so mundane. Studying the system shows us how the everyday event morphs into the black swan. As in the case of the avalanche, what really matters is not the snowflake but the snow.
Two more concepts are needed to round out our understanding of complexity theory. The first involves the frequency of extreme events relative to mild events in a complex system, referred to as a degree distribution. The second is the concept of scale.
The bell-curve degree distribution used in financial economics says that mild events happen all the time and highly extreme events practically never. Yet the bell curve is only one kind of degree distribution; there are many others. The degree distribution that describes many events in complex systems is called a power law. A curve that corresponds to a power law is shown below as Figure 2.
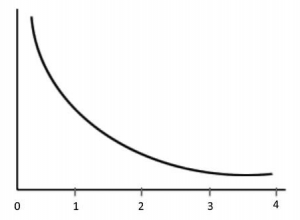
FIGURE 2: A curve illustrating a power-law degree distribution
In this degree distribution, the frequency of events appears on the vertical axis and the severity of events appears on the horizontal axis. As in a bell curve, extreme events occur less frequently than mild events. This is why the curve slopes downward (less frequent events) as it moves off to the right (more extreme events). However, there are some crucial differences between the power law and the bell curve. For one thing, the bell curve (see Figure 1) is “fatter” in the region close to the vertical axis. This means that mild events happen more frequently in bell curve distributions and less frequently in power law distributions. Crucially, this power law curve never comes as close to the horizontal axis as the bell curve. The “tail” of the curve continues for a long distance to the right and remains separated from the horizontal axis. This is the famous “fat tail,” which in contrast with the tail on the bell curve does not appear to touch the horizontal axis. This means that extreme events happen more frequently in power law distributions.
Television and blogs are filled with discussions of fat tails, although the usage often seems more like cliché than technical understanding. What is even less understood is the role of scale. The curve shown above in Figure 2 ends at some point for convenience. Yet in theory it could continue forever to the right without hitting the horizontal axis. This continuation would take the extent of possible catastrophes into unimaginable realms, like a 10.0 earthquake, something never recorded.
Is there a limit to the length of the tail? Yes, at some point the fat tail drops vertically to the horizontal axis. This truncation marks the limit of the system. The size of the greatest catastrophe in a system is limited by the scale of the system itself. An example would be an active volcano on a remote island. The volcano and the island make up a complex dynamic system in a critical state. Eruptions may take place over centuries, doing various degrees of damage. Finally the volcano completely explodes and the island sinks, leaving nothing behind. The event would be extreme, but limited by the scale of the system—one island. The catastrophe cannot be bigger than the system in which it occurs.
That’s the good news. The bad news is that man-made systems increase in scale all the time. Power grids get larger and more connected, road systems are expanded, the Internet adds nodes and switches. The worse news is that the relationship between catastrophic risk and scale is exponential. This means that if the size of a system is doubled, the risk does not merely double—it increases by a factor of ten. If the system size is doubled again, risk increases by a factor of a hundred. Double it again and risk increases by a factor of a thousand, and so forth.
Financial markets are complex systems nonpareil. Millions of traders, investors and speculators are the autonomous agents. These agents are diverse in their resources, preferences and risk appetites. They are bulls and bears, longs and shorts. Some will risk billions of dollars, others only a few hundred. These agents are densely connected. They trade and invest within networks of exchanges, brokers, automated execution systems and information flows.
Interdependence is also characteristic of markets. When the subprime mortgage crisis struck in early August 2007, stocks in Tokyo fell sharply. Some Japanese analysts were initially baffled about why a U.S. mortgage crisis should impact Japanese stocks. The reason was that Japanese stocks were liquid and could be sold to raise cash for margin calls on the U.S. mortgage positions. This kind of financial contagion is interdependence with a vengeance.
Finally, traders and investors are nothing if not adaptive. They observe trading flows and group reactions; learn on a continuous basis through information services, television, market prices, chat rooms, social media and face-to-face; and respond accordingly.
Capital and currency markets exhibit other indicia of complex systems. Emergent properties are seen in the recurring price patterns that technicians are so fond of. The peaks and valleys, “double tops,” “head and shoulders” and other technical chart patterns are examples of emergence from the complexity of the overall system. Phase transitions—rapid extreme changes—are present in the form of market bubbles and crashes.
Much of the work on capital markets as complex systems is still theoretical. However, there is strong empirical evidence, first reported by Benoît Mandelbrot, that the magnitude and frequency of certain market prices plot out as a power-law degree distribution. Mandelbrot showed that a time series chart of these price moves exhibited what he called a “fractal dimension.” A fractal dimension is a dimension greater than one and less than two, expressed as a fraction such as 1½; the word “fractal” is just short for “fractional.” A line has one dimension (length) and a square has two dimensions (length and width). A fractal dimension of 1½ is something in between.
A familiar example is the ubiquitous stock market chart of the kind shown in daily papers and financial websites. The chart itself consists of more than a single line (it has hundreds of small lines) but is less than an entire square (there is lots of unfilled space away from the lines). So it has a fractal dimension between one and two. The irregular pattern of ups and downs is an emergent property and a sharp crash is a phase transition.
A similar fractal pattern appears whether the chart is magnified to cover hours, days, months or years, and similar results come from looking at other charts in currency, bond and derivatives markets. Such charts show price movements, and therefore risk, distributed according to a power law and chart patterns with a fractal dimension significantly greater than 1.0. These features are at odds with a normal distribution of risk and are consistent with the power-law degree distribution of events in complex systems. While more work needs to be done in this area, so far the case for understanding capital markets as complex systems with power-law degree distributions is compelling.
This brings the analysis back to the question of scale. What is the scale of currency and capital markets, and how does it affect risk? If catastrophic collapses are an exponential function of scale, then every increase in scale causes a much greater increase in risk. Capital markets continually increase in scale, which is why the black swans keep coming in greater numbers and intensity.
Thinking about scale in capital markets today is like trying to measure the size of a field before the invention of the foot, the yard or the meter. There is no commonly agreed scaling metric for computing market risk using complexity and critical state dynamics. This lack is not unprecedented. Earthquakes have been known throughout history, yet the Richter scale used to measure the intensity and frequency of earthquakes was invented only in 1935. Earthquakes are phase transitions in complex tectonic plate systems, and their frequency and intensity measured by the Richter scale also correspond to a power law. The similarity of stock market charts to seismographic readings (seen in Figure 3 below) is not coincidental.
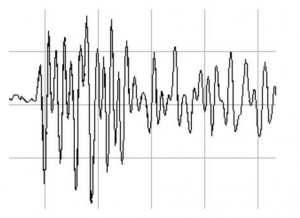
FIGURE 3: A sample seismograph reading
It will take some time for empirical work to catch up to theoretical work in this field. However, Nobel Prizes in economics likely await those who discover the best scaling metrics and accurately compute the slope of the power curve. But there is no need to wait for that work before drawing sound conclusions from the theory. Putting buildings on a known fault line was a bad idea even before the Richter scale was invented. Ignoring complexity and power laws in capital markets is a bad idea today even in the absence of empirical perfection. The edifice of capitalism may collapse in the meantime.
Even now one can make valuable inferences about the statistical properties of risk in capital and currency markets. There is no question that the scale of these markets, however best measured, has increased dramatically in the past ten years. A series of exchange mergers have created global megaexchanges. Deregulation has allowed commercial banks and investment banks to combine activities. Off–balance sheet activities and separate conduit vehicles have created a second shadow banking system as large as the visible system. Between June 2000 and June 2007, just prior to the start of the market collapse, the amount of over-the-counter foreign exchange derivatives went from $15.7 trillion to $57.6 trillion, a 367 percent increase. Between those same dates, the amount of over-the-counter interest rate derivatives went from $64.7 trillion to $381.4 trillion, a 589 percent increase. The amount of over-the-counter equity derivatives went from $1.9 trillion to $9.5 trillion in that same seven-year period, an increase of 503 percent.
Under Wall Street’s usual risk evaluation methods, these increases are not troubling. Because they consist of long and short positions, the amounts are netted against each other under the VaR method. For Wall Street, risk is always in the net position. If there is a $1 billion long position in a security and a $1 billion short position in a highly similar security, methods such as VaR will subtract the short from the long and conclude the risk is quite low, sometimes close to zero.
Under complexity analysis, the view is completely different. In complex systems analysis, shorts are not subtracted from longs—they are added together. Every dollar of notional value represents some linkage between agents in the system. Every dollar of notional value creates some interdependence. If a counterparty fails, what started out as a net position for a particular bank instantaneously becomes a gross position, because the “hedge” has disappeared. Fundamentally, the risk is in the gross position, not the net. When gross positions increase by 500 percent, the theoretical risk increases by 5,000 percent or more because of the exponential relationship between scale and catastrophic event size.
This is why the financial system crashed so spectacularly in 2008. Subprime mortgages were like the snowflakes that start an avalanche. Actual subprime mortgage losses are still less than $300 billion, a small amount compared to the total losses in the panic. However, when the avalanche began, everything else was swept up in it and the entire banking system was put at risk. When derivatives and other instruments are included, total losses reached over $6 trillion, an order of magnitude greater than actual losses on real mortgages. Failure to consider critical state dynamics and scaling metrics explains why regulators “did not see it coming” and why bankers were constantly “surprised” at the magnitude of the problem. Regulators and bankers were using the wrong tools and the wrong metrics. Unfortunately, they still are.
When a natural system reaches the point of criticality and collapses through a phase transition, it goes through a simplification process that results in greatly reduced systemic scale, which also reduces the risk of another megaevent. This is not true in all man-made complex systems. Government intervention in the form of bailouts and money printing can temporarily arrest the cascade of failures. Yet it cannot make the risk go away. The risk is latent in the system, waiting for the next destabilizing event.
One solution to the problem of risk that comes from allowing a system to grow to a megascale is to make the system smaller, which is called descaling. This is why a mountain ski patrol throws dynamite on unstable slopes before skiing starts for the day. It is reducing avalanche danger by descaling, or simplifying, the snow mass. In global finance today, the opposite is happening. The financial ski patrol of central bankers is shoveling more snow onto the mountain. The financial system is now larger and more concentrated than immediately prior to the beginning of the market collapse in 2007.
In addition to global financial descaling, another solution to complexity risk is to maintain the system size but make it more robust by not letting any one component grow too large. The equivalent in banking would be to have more banks, but smaller ones with the same total system assets. It was not that many years ago that the current JPMorgan Chase existed as four separate banks: J. P. Morgan, Chase Manhattan, Manufacturers Hanover and Chemical. A breakup today would make the financial system more robust. Instead U.S. banks are bigger and their derivatives books are larger today than in 2008. This makes a new collapse, larger than the one in 2008, not just a possibility but a certainty. Next time, however, it really will be different. Based on theoretical scaling metrics, the next collapse will not be stopped by governments, because it will be larger than governments. The five-meter seawall will face the ten-meter tsunami and the wall will fall.

Pages: 1 2 3 4 5 6 7 8 9 10 11 12 13 14 15 16 17 18 19 20 21 22 23 24 25 26 27 28 29 30 31 32 33 34 35 36 37 38 39 40 41 42 43 44 45 46